TL;DR the digital PR industry just LOVE a data visualisation sat on a blog/template page, but they aren’t the best performers.
You may have seen our digital PR format report, you might have even shared it. Well buckle up, we’re going again. Here is the campaign creative report. Catchy title, I know.
Are we as creative an industry as we tell ourselves?
The digital PR world produces some fantastic campaigns. Campaigns that drive millions of clicks, increase organic rankings and drive revenue for brands all over the world. Let’s go, team.
But if you are reading this then you know there has been a huge spike in digital PR in recent years, which means more and more campaigns are being executed at once. And with more and more campaigns on outreach, journalist inboxes are being bombarded more so than ever before.
With a sea of campaigns every month, ideation has become even more important, and creativity can be the key to coverage. But is it me or are a lot of campaigns looking very similar? Maybe it’s just me.
It’s why we set up Bottled Imagination. We wanted to do different, creative, but most of all effective work. If you saw our launch, you will have seen what we are all about (I don’t know how we kept straight faces throughout).
But If we want to do different work, we need to know what the industry is currently doing.
Introducing the digital PR campaign creative report.
333 different PR campaigns, researched over a 3-month period, assessed on how they landed and what they looked like.
Let’s dive right in 👇
Landing page vs blog page vs product page
When launching a digital PR campaign and content is hosted on-site, you have 3 options; a bespoke designed landing page, an existing template page to sit on your blog, or a product page. Which ones are proving popular right now…
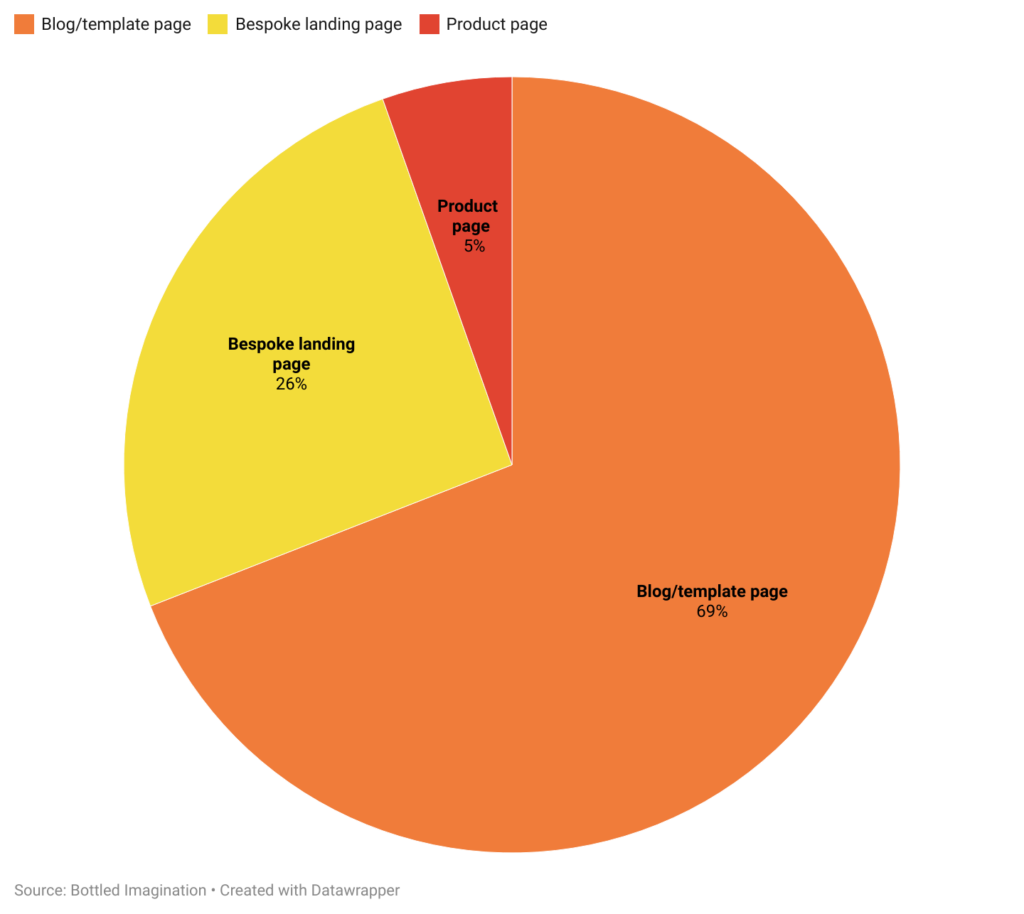
It turns out that 69% of campaigns are using existing templates and just 26% are bespoke designed and developed landing pages. The cost of design and development, along with time constraints could be the factor in having just 1 in 4 campaigns designed in this way.
But what you really want to know is, does it affect the number of links earnt?
The simple answer is yes.
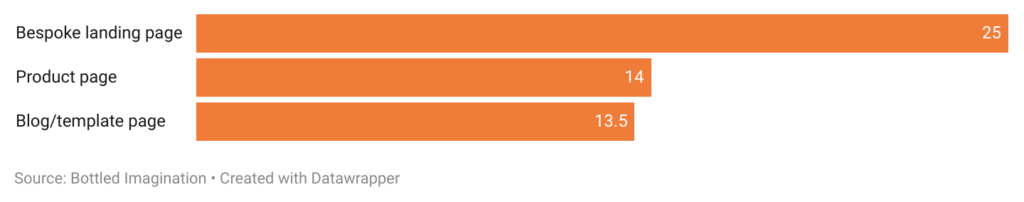
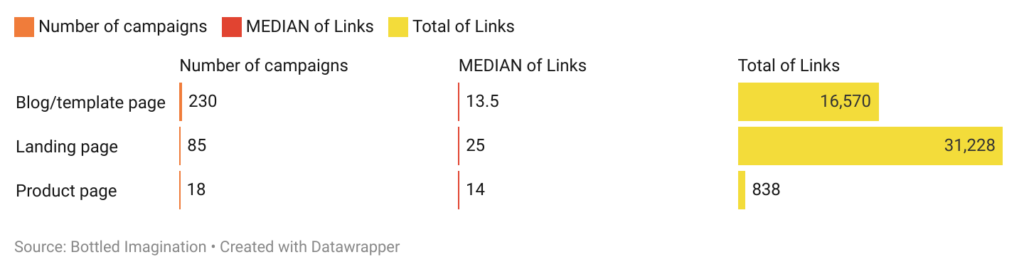
Bespoke landing pages secured a median of 25 links per campaign, almost double that of product pages and template pages.
It looks like that extra time and budget are well worth the results.
In fact, if we look at every campaign researched, of the 48,636 links earnt, 31,228 were linked to bespoke landing pages.
The type of creative
Videos, photography, data visualisations, and interactive assets. All different types of creative that can help engage the user, and encourage the journalist to cover your story. Or as some brands choose, no creative aspect at all (please never do this, like, please).
Let’s look at the numbers:
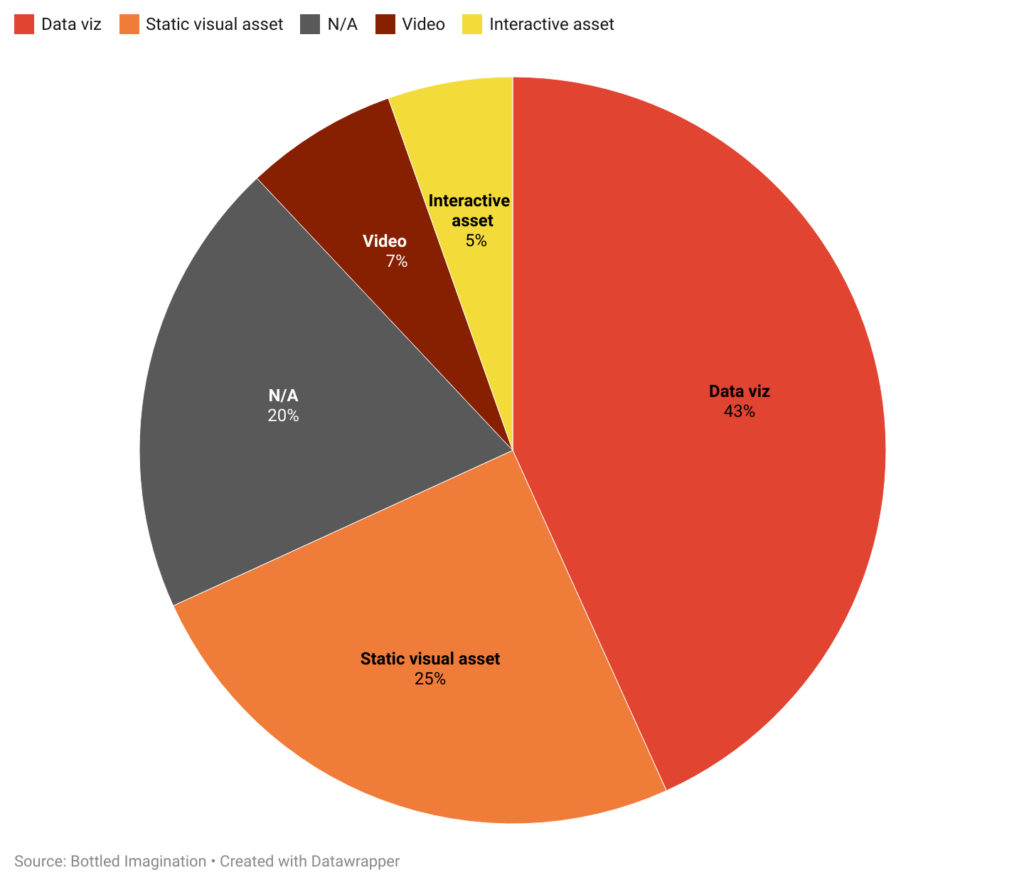
Coming out on top is campaigns that use some sort of data visualisation with 43% of campaigns. Think maps & infographics. Not far behind with 25% of the total campaigns being static visual assets. Think photoshoots, photographs (not stock imagery, that’s lazy) and product shots.
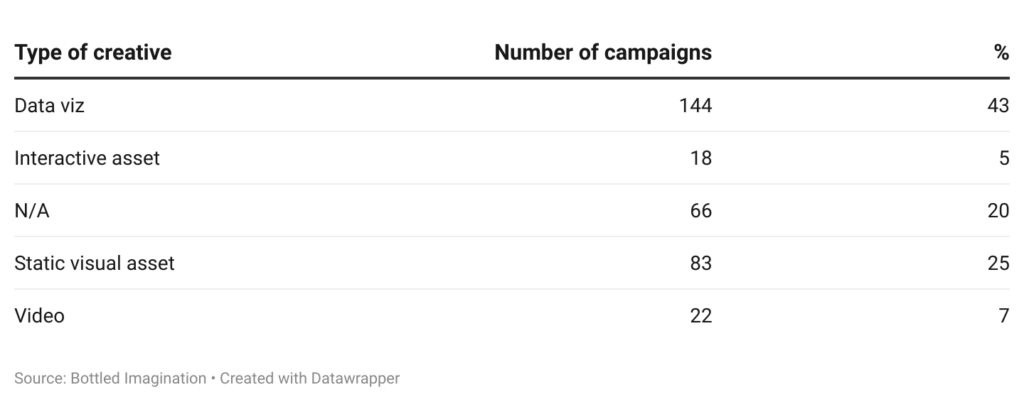
So data visualisations are popular with 43% of campaigns featuring them. But do they earn the most links?
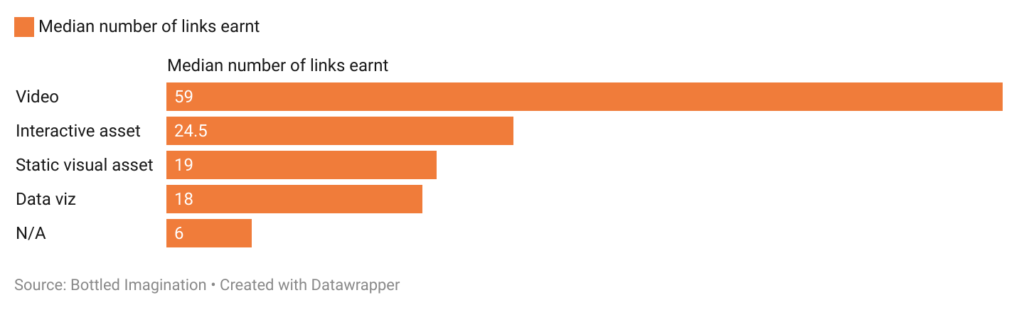
According to our research, campaigns that feature a hero video land the highest amount of coverage and links. And to no surprise, if you have no creative asset, you could struggle for coverage.
It is worth noting here that as there are far fewer interactive and video assets campaigns, the sample size is not as strong. But the numbers don’t lie.
Summary:
It’s a win for the creatives. Of the 333 campaigns researched, the data shows that campaigns hosted on a bespoke landing page and having either a video or an interactive element performed best at the end of 2022.
However, as with any report, the findings should be taken with a pinch of salt. What we all know is that story is the #1 factor in PR success. A great story can be shown through data visualization, hosted on a blog page and still get fantastic results.
The Bottled Imagination take:
With the numbers showing the majority of digital PR campaigns are hosted on template pages, and have standard data visualisation there has never been a better time to stand out and do creative work. Content is king and if the crowd is going one way, then Bottled Imagination is going to go the other, producing some big audacious, out-of-the-box campaigns along the way.
Not only links can be achieved, but these campaigns can also do much more for the brand and marketing of the brands. With the right strategy, these are full imagination campaigns. Campaigns that are amplified on different channels using a creative asset that can be repurposed and optimised for every platform.
The honourable mentions
After looking through 333 campaigns we thought we would pick out some of our favourites. Shout out to the agencies and brands featured:
Favourite landing page campaign – https://nordpass.com/most-common-passwords-list/
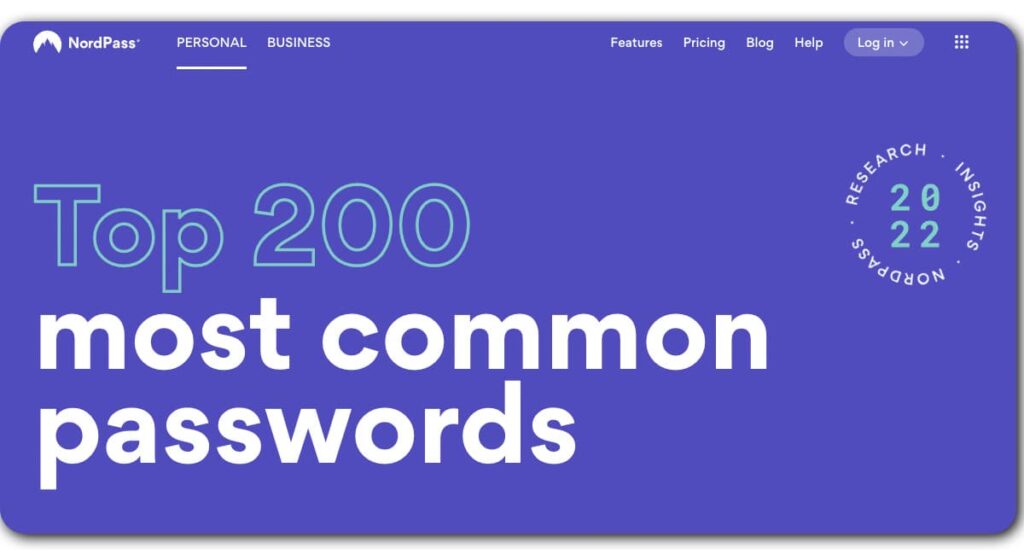
NordPass conducted research on the most common password in 2022. The campaign had numerous angles and featured a super clean design with interactive elements on the page. Bosh.
Favourite video campaign – https://www.barilla.com/en-gb/passive-cooking
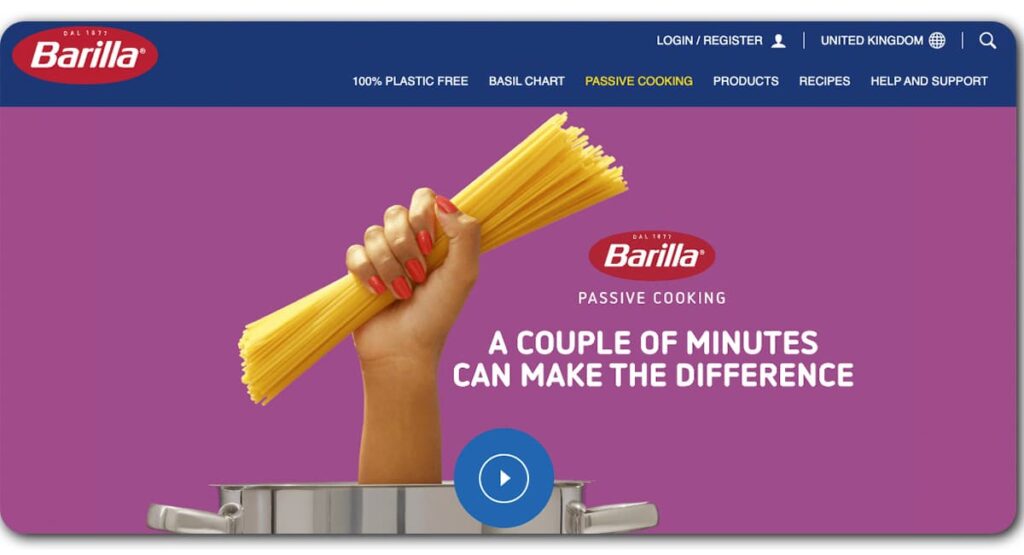
With the cost of living crisis and focuses on sustainability on the rise, Barilla launched their passive cooking campaign. An alternative way of cooking pasta that reduces CO2 emissions. A super clean landing page, a hero video at the top and a lot of earnt media. 10/10.
Favourite interactive asset – https://areyoupressworthy.com/
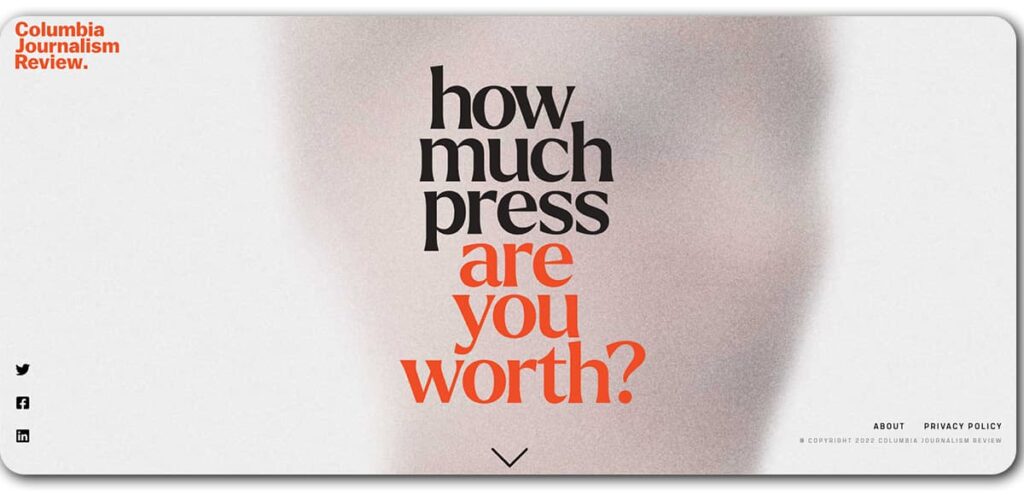
Columbia Journalism Review launched a hard-hitting campaign called “How much press are you worth”. The campaign focussed on media bias surrounding coverage of missing persons. If you are going to leave our website to look at a campaign, make it this one. Beautifully designed, stunningly shot video, a campaign we all wish we produced.
Report methodology
We researched 333 campaigns over a 3-month period between September and November 2022. Link numbers were reported from Ahrefs and manual data entry categorised each campaign.
We did not look into link relevance or DA, the report merely looks at the type of creative used within the digital PR industry at this moment.
Reactive PR campaigns were not used in this report and campaigns included must have content/be hosted on a brand’s website.
For link averages, we used the median. This ensured that when certain campaigns achieved links in the 1000s, this didn’t skew the numbers.