
I’m a marketer and I’m going to beat the stock market.
First off, here’s the disclaimer. This is not financial advice. I’m not a financial expert and, if anything, I’m a sub-par investor (and that’s being generous). But today, I’m going to beat the stock market.
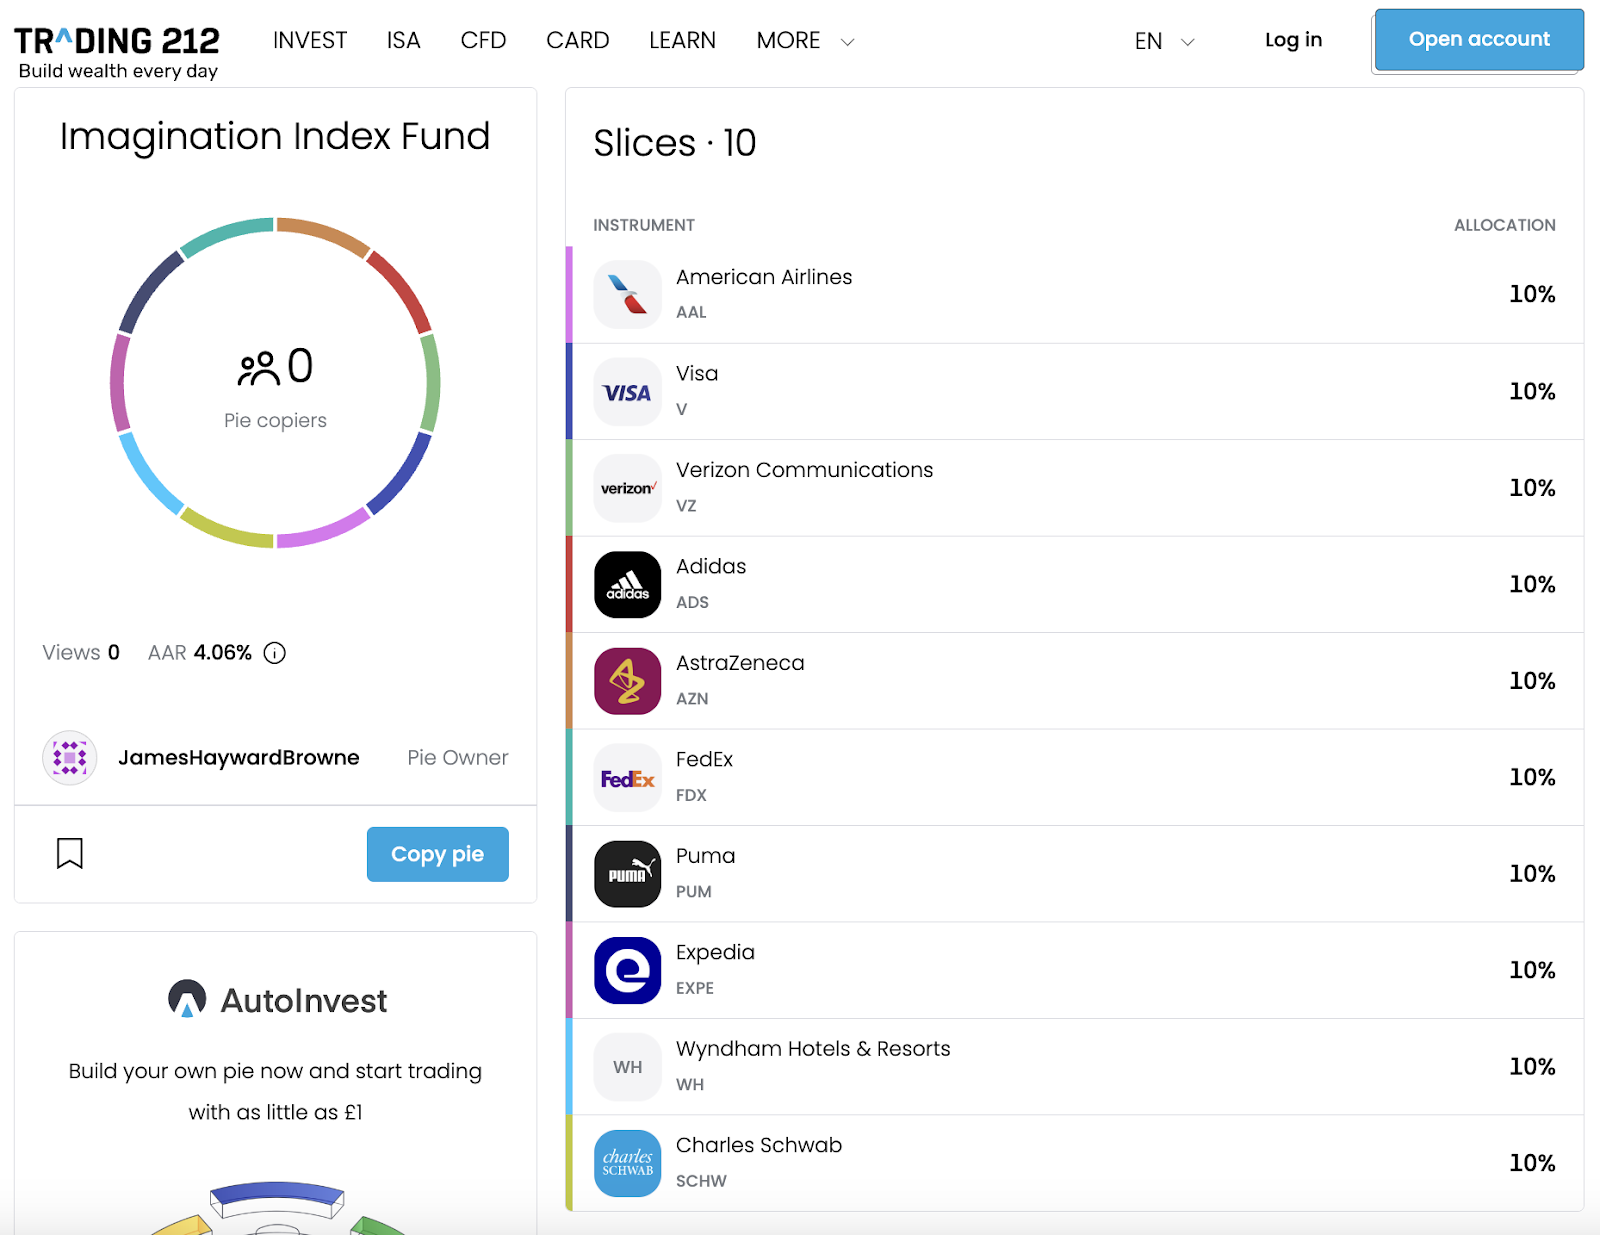
Here’s the TL: DR. I have used my years of investing experience (countless poor stock choices), my faultless SEO knowledge (debatable), and my marketing nous (I read a lot of useless stuff on Twitter) to choose 10 stocks that are BOUND to succeed. I am putting the mighty sum of ONE THOUSAND POUNDS into my index which I’m titling the imagination index. I know how to stick to a theme.
(If you want to butcher my methodology and tell me of all the caveats associated, you’ll need to read to the end, sorry).
So here are the stocks you’re going to want to add to your portfolio:
- Adidas
- Visa
- Verizon
- Charles Schwab corporation
- American airlines group
- AstraZeneca
- Expedia Group
- Wyndham Hotel Group
- Puma
- FedEx
These stock choices are based on the theory that they are being searched for more than their competitors, even though this interest isn’t yet reflected in the financial markets. Therefore, they are likely to grow.
Now, it would be a pretty boring statement if I didn’t back my bulletproof, irrefutable theory. So, I’m investing £1000 of my own money in creating The Imagination Index Fund. I’ll give an update every month and see how the experiment goes. If you want to check in on my progress, simply click here.
The theory: why us marketers should care
Working in SEO and PR, I am a big believer in brand-building work. An effective SEO should be a brand manager as well as an SEO. But, for marketers on this side of the organic/paid trench, one of the hardest jobs we do is communicating to budget holders the value of our work, and reasons why we need to loosen those tightly held budgets. If we can show that activity such as digital PR can increase bottom line revenue prospectively rather than respectively we can get the decision makers on board.
Smarter people than me have done lots of research on something called ✨ share of search ✨ and I can’t lie… I love it.
So what is Share of Search? Good question.
You’ve probably heard of Share of Voice; this is kind of similar. Share of Voice assesses a variety of paid and organic metrics within the market. In contrast, Share of Search is the number of searches a brand receives divided by the searches for all brands within a competitor set over a certain period. Such metrics provide marketers with insights into brand awareness and the brand’s authority among its customers.
I’ve got something else for you: excess Share of Voice (eSOV). This is when brands achieve a higher share of voice than their market share. It indicates a long-term potential to increase their slice of the pie and grow their brand. The trouble is, with so many digital channels and so much marketing now paid and earned, it is very tricky to accurately measure. This is probably why it is done as an annual activity rather than an ongoing one.
Share of Search is better. It has the same correlation to market share, but it focuses further down the funnel–what people are searching for.
Share of Search has been proved to represent 83% of a brand’s market share. In simple terms, it can be a proxy for market share and, in turn, a possible predictor of future business outcomes.
Analysis reveals a strong correlation between Share of Search and market share among leading Fortune 500 companies. When Share of Search exceeds the market share, the market share tends to eventually increase to align with Share of Search.
So here’s when the penny dropped. If Share of Search is a predictor of future market share, can we use SEO to game and win in the stock market?
Worth a shot, right?
How I’m using SEO and brand building to beat the stock market
Time for some number crunching. Here’s the step-by-step of what I’ve done:
- Pick my categories. For this experiment, I’ve picked 11 different categories. Naturally, some categories can be affected by factors outside of marketing control(do I need to remind the travel industry about COVID?) The categories range from US airlines to athletic apparel brands. Within each category, I needed several brands that could be traded on any exchange but were also direct competitors. I ended up with the following:
- Athletic Apparel
- US Retail
- Credit Cards
- Consumer Electronics
- Online Travel Agencies
- Investment banking
- US airlines
- Shipping and logistics
- Hospitality
- Pharma
- US Telecommunications
- Find the company’s share of search. I used a timescale of the previous 3 months. I not only used the brand name but also the brand + product, and various other brand + keywords to total their brand searches.
- Find the company’s market share. Now, I know there are better ways to do this, and far more accurate ones. In an ideal world, I would be looking at company earnings reports and revenues, but with companies reporting at different times, I needed a better (easier) solution. So, I used the market cap as a proxy for market share. Market capitalisation reflects the overall value of a company in the market, and while it is not a direct measure of market share, it provides a relative indicator of a company’s size and influence within its industry. By comparing Share of Search to market cap, I can gauge whether a company’s brand awareness (as indicated by Share of Search) is outpacing its financial market presence, and hopefully predict future movement on the stock exchange
- Find the excess Share of Search. By putting both into percentages, I could find an excess search score. If a brand had 19% of the market share but a 29% share of search, they would have a +10 excess Share of Search meaning we could be on to a winner.
- Find their Share of Search trend. I wanted a secondary measure. After all, just because a brand gets searched more than its competitor doesn’t mean it is earning more revenue (especially in complex B2B markets). Therefore, I introduced a trend of Share of Search metric. I looked at the monthly trends of each company and noted if they were trending positively or negatively against their competitors.
I now had a huge dataset.
11 categories and 45 companies, all with the Share of Search, the excess Share of Search and whether they were trending up or down in their respective category.
So which companies to buy? I decided to analyse the companies to see if they had a positive excess share of search AND if they had been trending up (stealing share of search against their competitors). I would see that as a forecast for company growth–that would be a company I’d invest in.
Take a look at the example below:
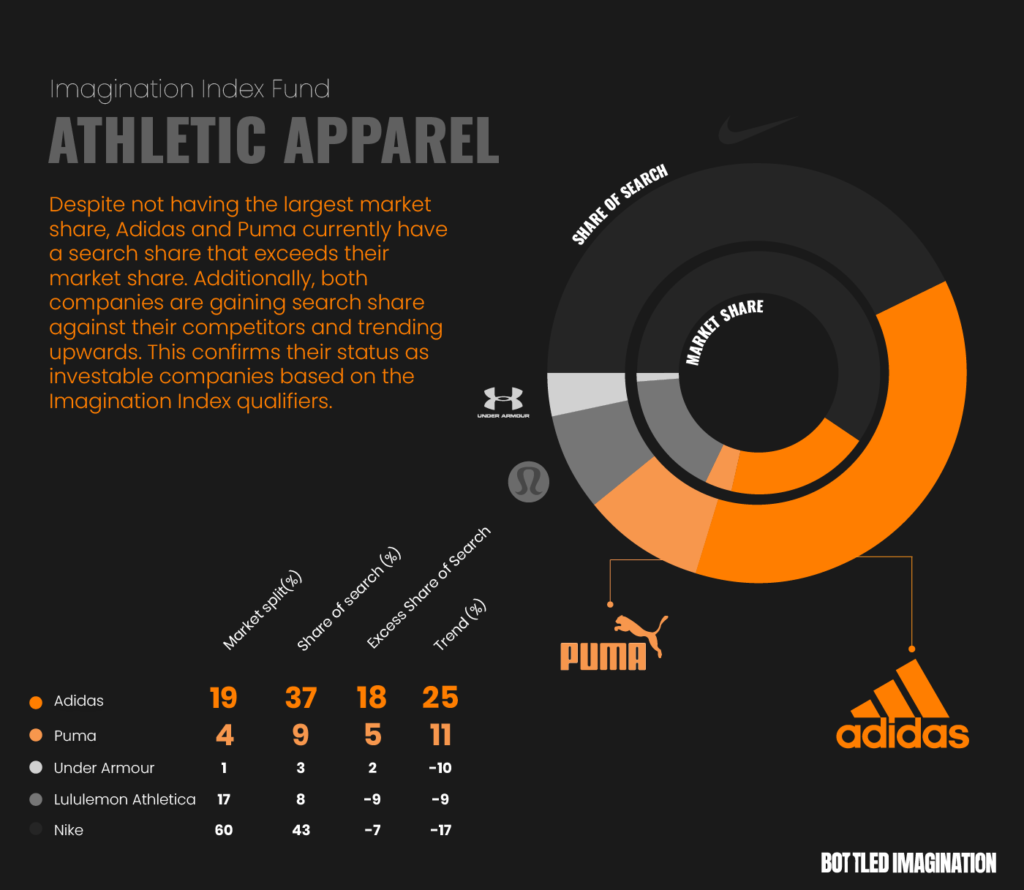
According to my numbers, Adidas has a 19% share of the market between them, Nike, Under Armour, Lululemon & Puma.
They have a share of search of 37.11% giving them an excess share of search score of 18.11.
Looking good.
Not only that, but over the last 3 months they have gained 25% of share of search against their competitors, trending very much in the right direction.
Adidas is my golden pick of all the companies I researched.
Can marketing experts beat the stock market?
Who knows? But it’s a fun experiment to find out. It’s long been known to the business world that top-of-funnel brand-building activity leads to increases in brand search and turns revenue. However, this experiment focuses on metrics further down the funnel when brands are being directly searched for. Therefore, they should be more predictive of market share than Share of Voice.
As PRs, it’s what we do best. We get brands seen, get people talking, searching, and eventually purchasing.
I hope this doesn’t count as insider trading.
The never-ending list of caveats
OK financial and SEO experts, there are A LOT of meaty caveats to this. But this is an experiment, so let’s just see what happens. That being said, I did try and make this as accurate as can be, so here are a few additional details:
- I chose companies that didn’t own loads of other companies. I didn’t choose soft drinks because Coca-Cola owns the market with many sub-brands; therefore branded search for “Coke” would not be relatable to market share.
- Share of Search research has seen the most success on consumer goods, so I wanted to show a variety of industries for a more varied experiment.
- Brand searches and correlation to market share will differ in each category. Some will be stronger than others, but again this is an experiment and I’ve covered a variety of different markets.
- Stock prices can fluctuate for a million reasons aside from just revenue and sales, but looking retrospectively is never as fun as a live experiment.
- This also doesn’t take into account actual market trends. For instance, travel could be hit with a lot of consumers losing confidence and, even though they are being searched for a lot, the actual market could be on a downward trend.
- Oh, the macroeconomic situation might affect things too.
If you want to see the full data set, or talk about the excess Share of Search for your brand drop me a message.
If you want further reading share on share of search I’d recommend this article:
- https://www.marketingweek.com/mark-ritson-share-of-search-share-of-voice/
*Huge shoutout to the team at My Telescope and the work they are doing on Share of Search*